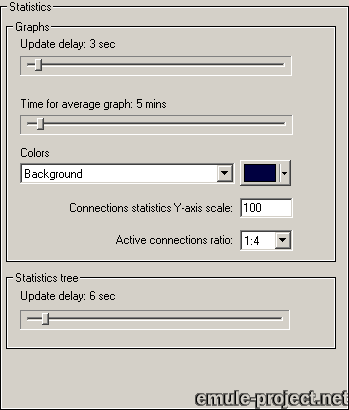
Graphs
o Update delay
Determines how often the graphs are refreshed. Setting this value too low, i.e.
very fast update, can have an impact on CPU usage
o Time for average graph
By default the average graphs are calculated from the values of the last 5 minutes.
This is a long term performance indicator.
o Colors
Choose which part of the statistic display to modify from the drop down list
then use the color selector to apply the color. Even the color of the little
speed indicator next to eMule's tray icon can be changed.
o Connections Statistics Y-Axis Scale
In the Stats tab directly below the details statistic tree is a graph indicating
the currently active connections and number of up- and downloads. This graph
is usually scaled from 0 to 100 but this setting allows to change it, thus increasing
or decreasing the resolution of the graph.
o Active Connections Ratio
Depending on the internet connections and settings the number of active connections
is very dynamic but usually above 100. To display the entire connections graph
this setting can be used to scale it down. A factor of e.g. 1 : 4 will divide
the number of active connections by 4 then displaying this value as the graph.
Hint:
To increase the resolution for number of up- and downloads and still display
the complete connections graph the above two settings are useful. Decreasing
Connections Statistics Y-Axis Scale will increase resolution for the Up-/Download
graph and increasing the Active Connections Ratio will make sure that the graph
is still displayed.
Statistic Tree
o Update delay
Refresh interval of the detailed statistic list. See Update delay in
Graphs for a note on CPU usage.
Applies to version: .29a +
Last update on: 2003-06-03 by Monk